The Vancouver region draws on a water network that is the envy of many metropolitan areas around the world. The source watersheds are protected, the treatment system is publically owned, revenues are reinvested, and the water quality is first class. The Water Planning Lab aims to reviews water management practices in Vancouver with particular attention to residential water consumption and municipal efforts to manage water resources efficiently.
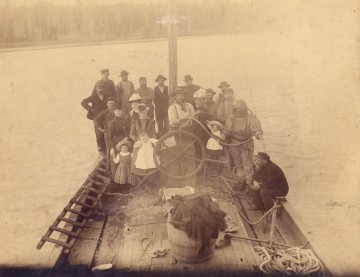
Diver Richard Thomas Llewellyn preparing to inspect a broken water main in the First Narrows, 1890
The region’s municipalities came together to collaborate on water management at the beginning of the twentieth century, make the issue one of the first to receive regional coordination. Even today, the Greater Vancouver Water District (GVRD) is the largest of the four legal entities that comprise Metro Vancouver. Water sales from Metro Vancouver to municipal governments generated $243.8 million of revenues in 2014, or 37% of Metro Vancouver’s total budget. When drinking water and sewage are taken together, these items used 70% of Metro Vancouver’s budget, far more than the Regional District (10%), or the Housing Corporation (6%) [2].
It has been over a decade that Metro Vancouver put the notion of sustainability at the center of its operating and planning philosophy. The current vision for the region, as outlined in the Metro Vancouver 2014 Strategic Plan: creating our future in a livable region, identified the “conservation of resources” as a top priority. The region’s strategic plan also explicitly aims to “promote the conservation of drinking water” with the goal of reducing “peak day per capita water use by 5% by 2015 from the 2010 level”. A few municipalities in the region have also established water conservation targets. The City of Vancouver as part of its Greenest City 2020 Action Plan seeks to reduce per capita consumption by one third from 2006 levels by 2020, and Surrey in its Sustainability Report of 2014 aims to reduce water consumption per capita per day to 260 liters by 2028.
Yet while water conservation targets have been set, and the water network is admirable, a sustainability gap remains. On certain metrics, especially total water consumption and water consumption per capita, the region performs poorly in comparison to other metropolitan regions, even those with comparable climates. The region has also been slow in adopting best practices for water management such as universal water metering. Lastly, the region is investing far more in expanding water supply than in water conservation, efficiency and demand management. A supply-based approach is likely to continue to dominate water planning in the region as long as there is weak evidence that water conservation programs are effective. To close the sustainability gap with regards to water management, regional and municipal policies must align better with the stated values and existing commitments to sustainability, natural resource conservation, and efficiency.
To put the conversation in context, here is an interactive chart that compares the water consumption in the regions of Seattle, Portland and Vancouver [3]. The size of the blocks shows the total water consumption on 2013 and the colors shows the percapita consumption, green being the smaller consumptions and red the bigger. You can left click to see the breakdown of the information and right click to go back.
[1] Metro Vancouver is a political body that represents the residents of the region under four separate legal entities: Greater Vancouver Regional District (GVRD); Greater Vancouver Water District (GVWD); Greater Vancouver Sewerage & Drainage District (GVS&DD); Metro Vancouver Housing Corporation (MVHC). The GVRD, GVWD, GVS&DD, and MVHC are each governed by a separate Board of Directors composed of elective representatives from the representative members who have chosen to participate in the provision of the service.
[2] Metro Vancouver’s Budget in Brief
[3] Cities with a population of less than 15,000 were not considered.
Metro Vancouver. 2014. Water Consumption Statistics 2013. Accessed 29 December 2015
City of Portland. 2014. Statistical Report FY 2013-14. Accessed 29 December 2015
Seattle Public Utilities. 2014. Annual Survey of Wholesale Customers: Summary of Results. Accessed 29 December 2015